

Monitoring keeps an eye on your websites, APIs, servers, DNS, and certificates so you find out about outages before your customers do — built for anyone who needs reliable uptime tracking without managing complex infrastructure themselves.
Overview
- Watches many kinds of targets: websites, APIs, TCP ports, SSL certificates, DNS records, keywords, redirects, ping, cron heartbeats, and even other companies' status pages.
- Checks from multiple regions and only flags an outage once enough regions agree, so one flaky location won't wake you up for nothing.
- Automatically tracks incidents with a timeline, and lets you set up dependencies between monitors to avoid getting flooded with alerts.
- Lets you schedule maintenance windows so planned work doesn't trigger alerts.
- Routes alerts to email, Slack, Telegram, Teams, Discord, or a webhook.
- Can publish a public status page on your own domain.
Check the Monitors page
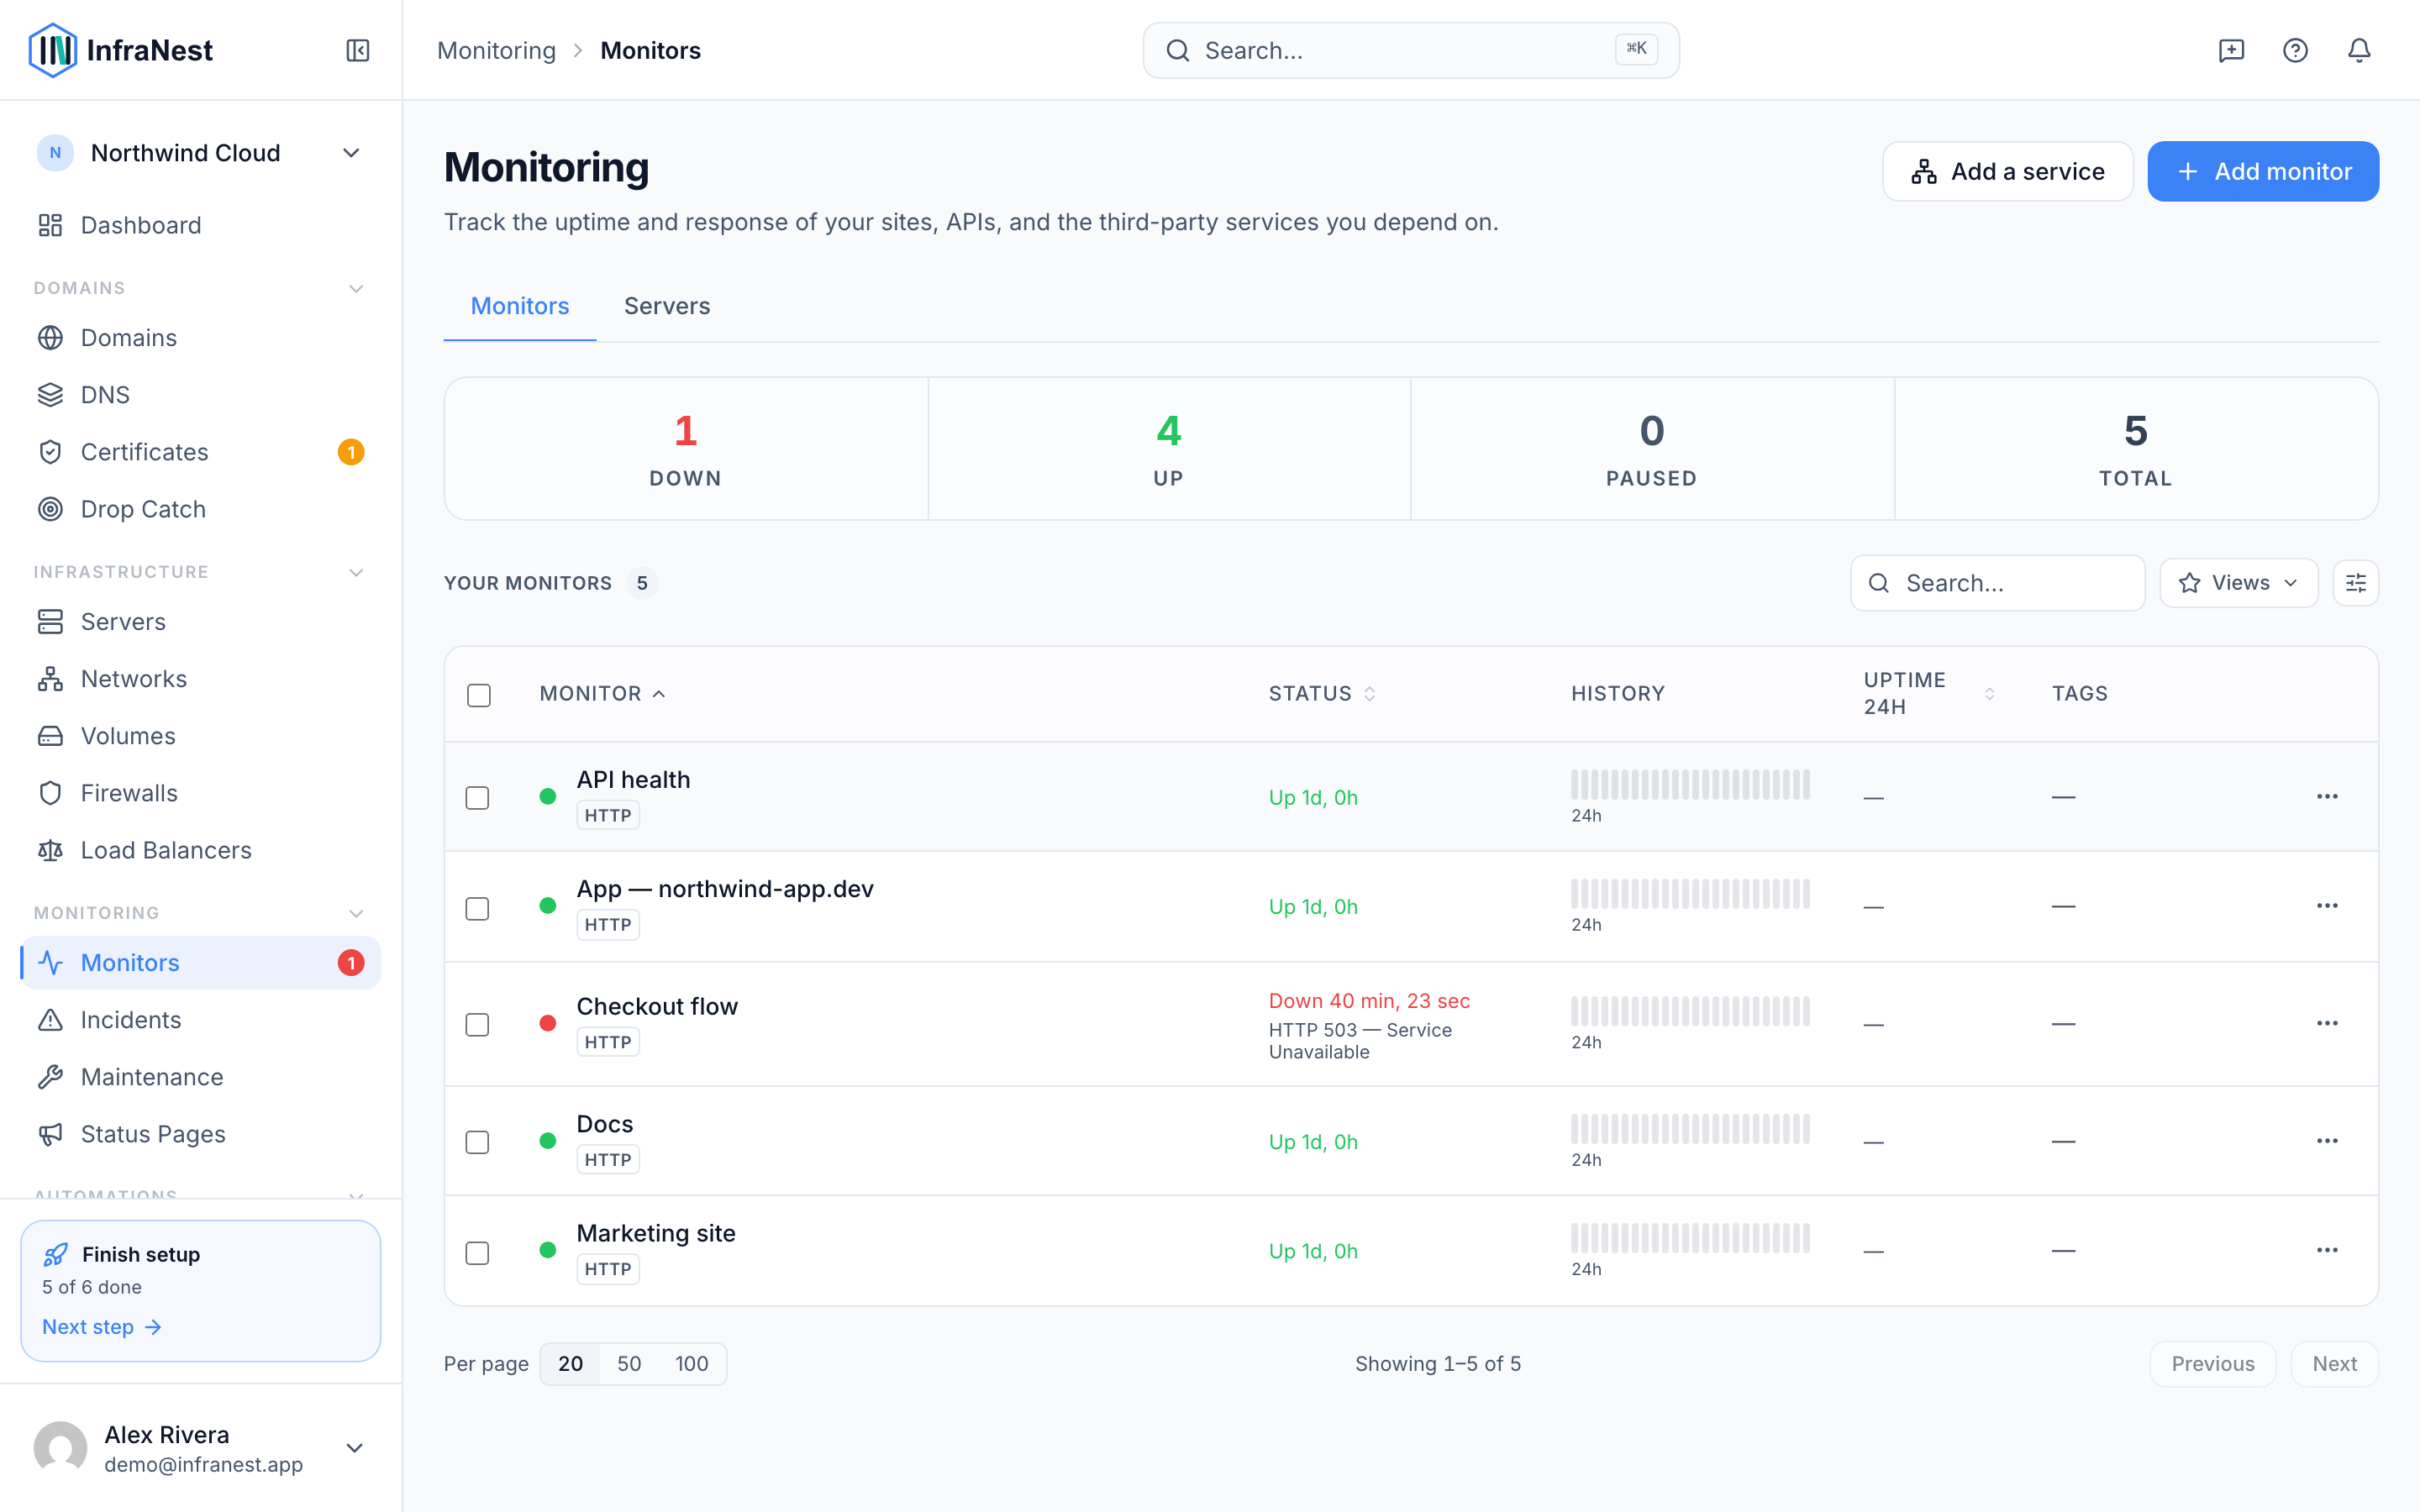
- Open Monitors from the sidebar.
- Review the list of checks, each showing its current Status — Up, Down, Degraded performance, In maintenance, or not yet checked — along with its Uptime 24h.
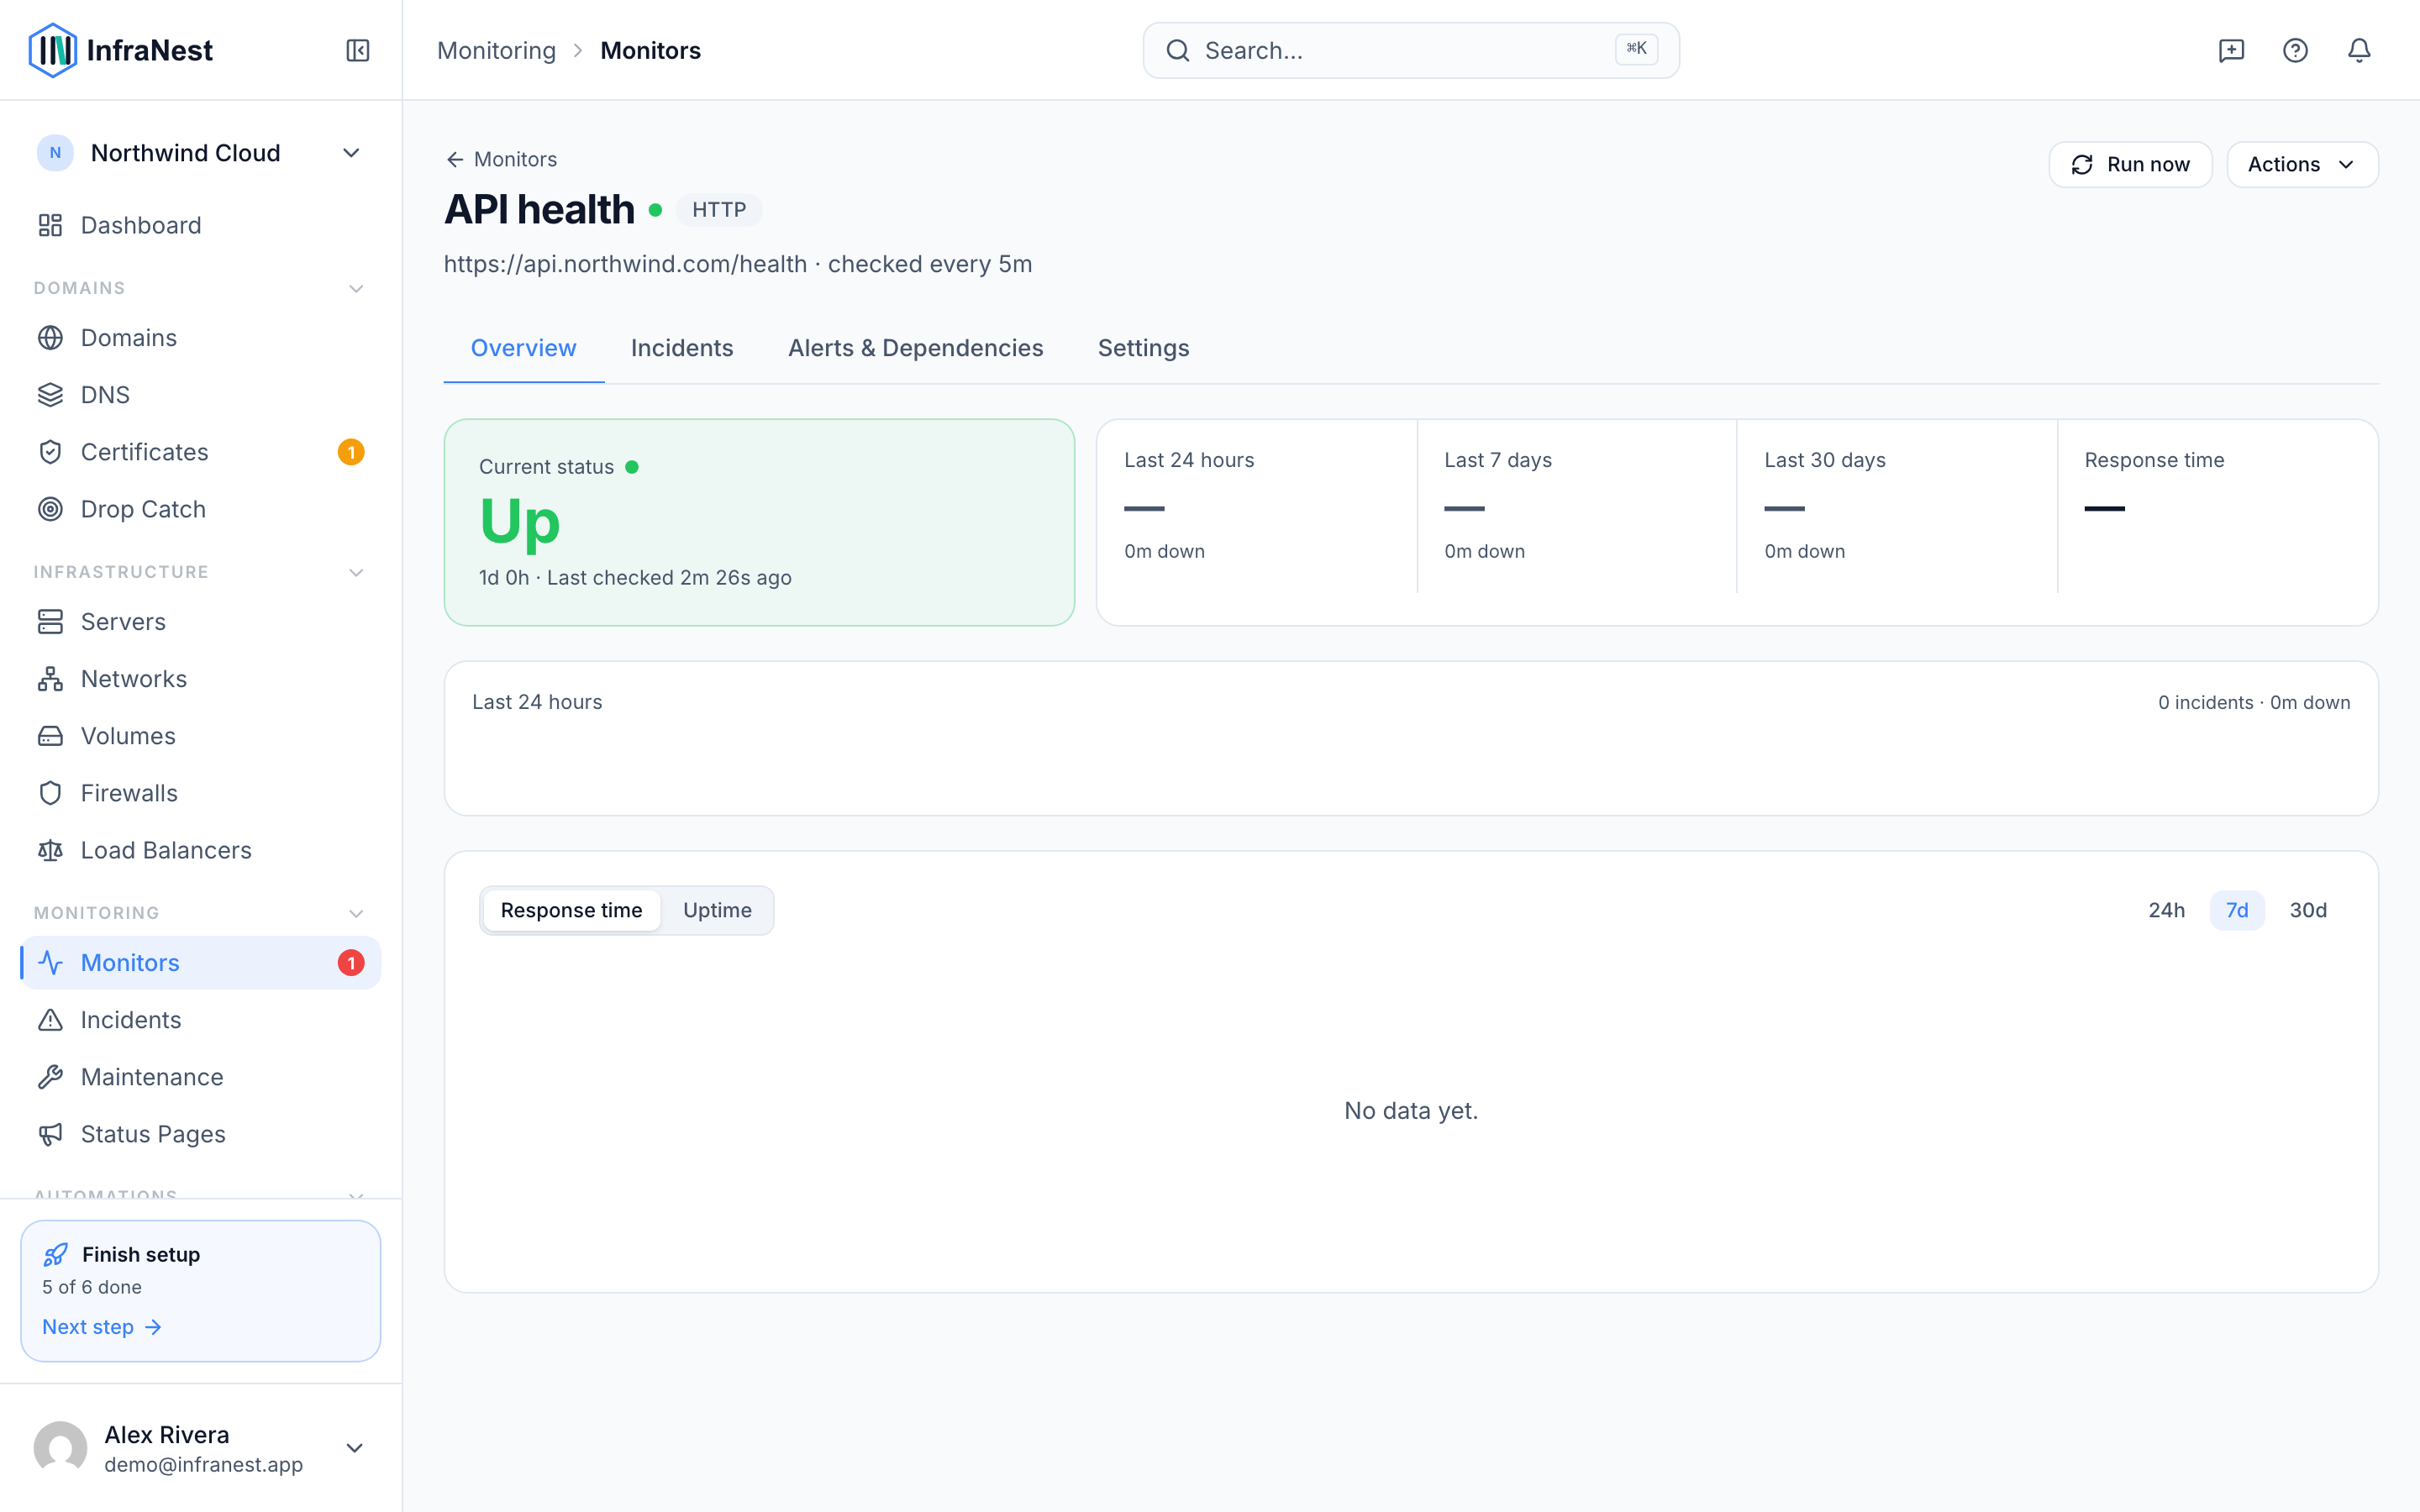
- Select Open monitor on any row to see per-region results and its History.
- Select Add monitor to create a new check.
NoteA monitor only turns Down after enough regions agree there's a real problem — this avoids false alarms from a single region having a bad moment.
Add a monitor
- From the Monitors page, select Add monitor.
- Choose what to monitor — for example HTTP / website monitoring, API monitor, Port monitoring, Keyword monitoring, Ping monitor, Redirect monitoring, DNS monitoring, Heartbeat / Cron monitor, or Server metric alert.
- Fill in the details for that monitor type, such as the URL to monitor, Hostname, or Check interval.
- Adjust Advanced settings if needed, such as Response assertions, Failed checks before alerting, or Also verify SSL certificate.
- Select Create monitor to save it.
TipUse Check from with Monitor from multiple regions at once so a single region's hiccup doesn't cause a false alert.
Set up alerts and maintenance
- Open a monitor by selecting Open monitor.
- Go to Alerts & Dependencies to attach an alert channel — select Attach alert channel and choose where alerts go (email, Slack, Telegram, Teams, Discord, or a webhook).
- To prevent alert storms, set up Parent monitors or Child monitors under Dependencies.
- To schedule planned work without triggering alerts, use Mark as expected / planned downtime and check Next maintenance or No upcoming maintenance for what's scheduled.
- Select Save changes when you're done.
Publish a status page
- Go to Status Pages in the sidebar.
- Select Add to status page on the monitors you want to make public.
- Confirm the name shown as “{name}” for each item.
- Open Manage status pages to review layout and which components are visible.
- Use Open status page to see how it looks to visitors.
Tips
- Use Silence alerts temporarily instead of pausing a monitor if you just want to mute notifications for a bit.
- Check Recent checks and Response time on a monitor's page to spot slow responses before they become outages.
Was this article helpful?
Related articles
Add a monitorSet up a check to watch a website, API, certificate, DNS record or anything else, and get told when something's wrong.Monitor typesInfraNest can watch ten different kinds of target. Pick the one that matches what you want to check.Monitor a cron job or scriptMost checks reach out to something of yours. A heartbeat monitor works the other way around: your backup script, cron job or scheduled task calls in to…Regions and probesInfraNest runs your checks from several locations ("probes"), so a problem in one place doesn't cause a false alarm — and you can see how your service looks…